//-------------------------------------
< GDP 와 GNP 차이 >
* GDP(Gross Domestic Product) 국내 총생산
- 나라의 국경 안에서 생산된 총 금액, 외국인이 생산한 금액도 포함
- 경제가 세계화 되면서 GDP가 경제사정을 더 잘 반영
* GNP(Gross National Product) 국민 총생산
- 나라의 국민이 생산한 총 금액, 자국민이 외국가서 번 돈도 포함
GNP by Country
https://www.macrotrends.net/countries/ranking/gnp-gross-national-product
//-------------------------------------
< GDP 종류 >
* 명목 , noninal
- 각국의 통화단위로 산출한 GDP를 달러로 환산
- GDP(명목)은 국력에 비례
List of countries by GDP (nominal)
https://en.wikipedia.org/wiki/List_of_countries_by_GDP_(nominal)
//
| GDP (US$ million) by country |
||||||||
| Country/Territory | Region | IMF | United Nations | World Bank |
||||
| Estimate | Year | Estimate | Year | Estimate | Year | |||
| 1 | United States | Americas | 22,939,580 | 2021 | 20,893,746 | 2020 | 20,936,600 | 2020 |
| 2 | China | Asia | 16,862,979 | 2021 | 14,722,801 | 2020 | 14,722,731 | 2020 |
| 3 | Japan | Asia | 5,103,110 | 2021 | 5,057,759 | 2020 | 4,975,415 | 2020 |
| 4 | Germany | Europe | 4,230,172 | 2021 | 3,846,414 | 2020 | 3,806,060 | 2020 |
| 5 | United Kingdom | Europe | 3,108,416 | 2021 | 2,764,198 | 2020 | 2,707,744 | 2020 |
| 6 | India | Asia | 2,946,061 | 2021 | 2,664,749 | 2020 | 2,622,984 | 2020 |
| 7 | France | Europe | 2,940,428 | 2021 | 2,630,318 | 2020 | 2,603,004 | 2020 |
| 8 | Italy | Europe | 2,120,232 | 2021 | 1,888,709 | 2020 | 1,886,445 | 2020 |
| 9 | Canada | Americas | 2,015,983 | 2021 | 1,644,037 | 2020 | 1,643,408 | 2020 |
| 10 | South Korea | Asia | 1,823,852 | 2021 | 1,637,896 | 2020 | 1,630,525 | 2020 |
| 11 | Russia | Europe | 1,647,568 | 2021 | 1,483,498 | 2020 | 1,483,498 | 2020 |
//
List of countries by GDP (nominal) per capita
https://en.wikipedia.org/wiki/List_of_countries_by_GDP_(nominal)_per_capita
* 구매력 평가 , PPP(Purchasing Power Parity )
- 나라별 물가수준을 고려한 GDP
- 비슷한 수준의 나라간의 비교는 정확한 편
- 1인당 GDP(PPP)는 생활 수준과 비례, 불평등 정도인 지니계수도 고려해야 함
List of countries by GDP (PPP)
https://en.wikipedia.org/wiki/List_of_countries_by_GDP_(PPP)
List of countries by GDP (PPP) per capita
https://en.wikipedia.org/wiki/List_of_countries_by_GDP_(PPP)_per_capita
//-------------------------------------
* 참고
https://namu.wiki/w/GDP(PPP)
PPP를 자동차에 비유
1인당 GDP(명목)가 낮지만 1인당 GDP(PPP)가 비교적 높은 경우는 양산형 대중차
1인당 GDP(명목)가 높고 1인당 GDP(PPP)가 비교적 낮은 경우는 프리미엄 브랜드
//-----------------------------------------------------------------------------
//-----------------------------------------------------------------------------
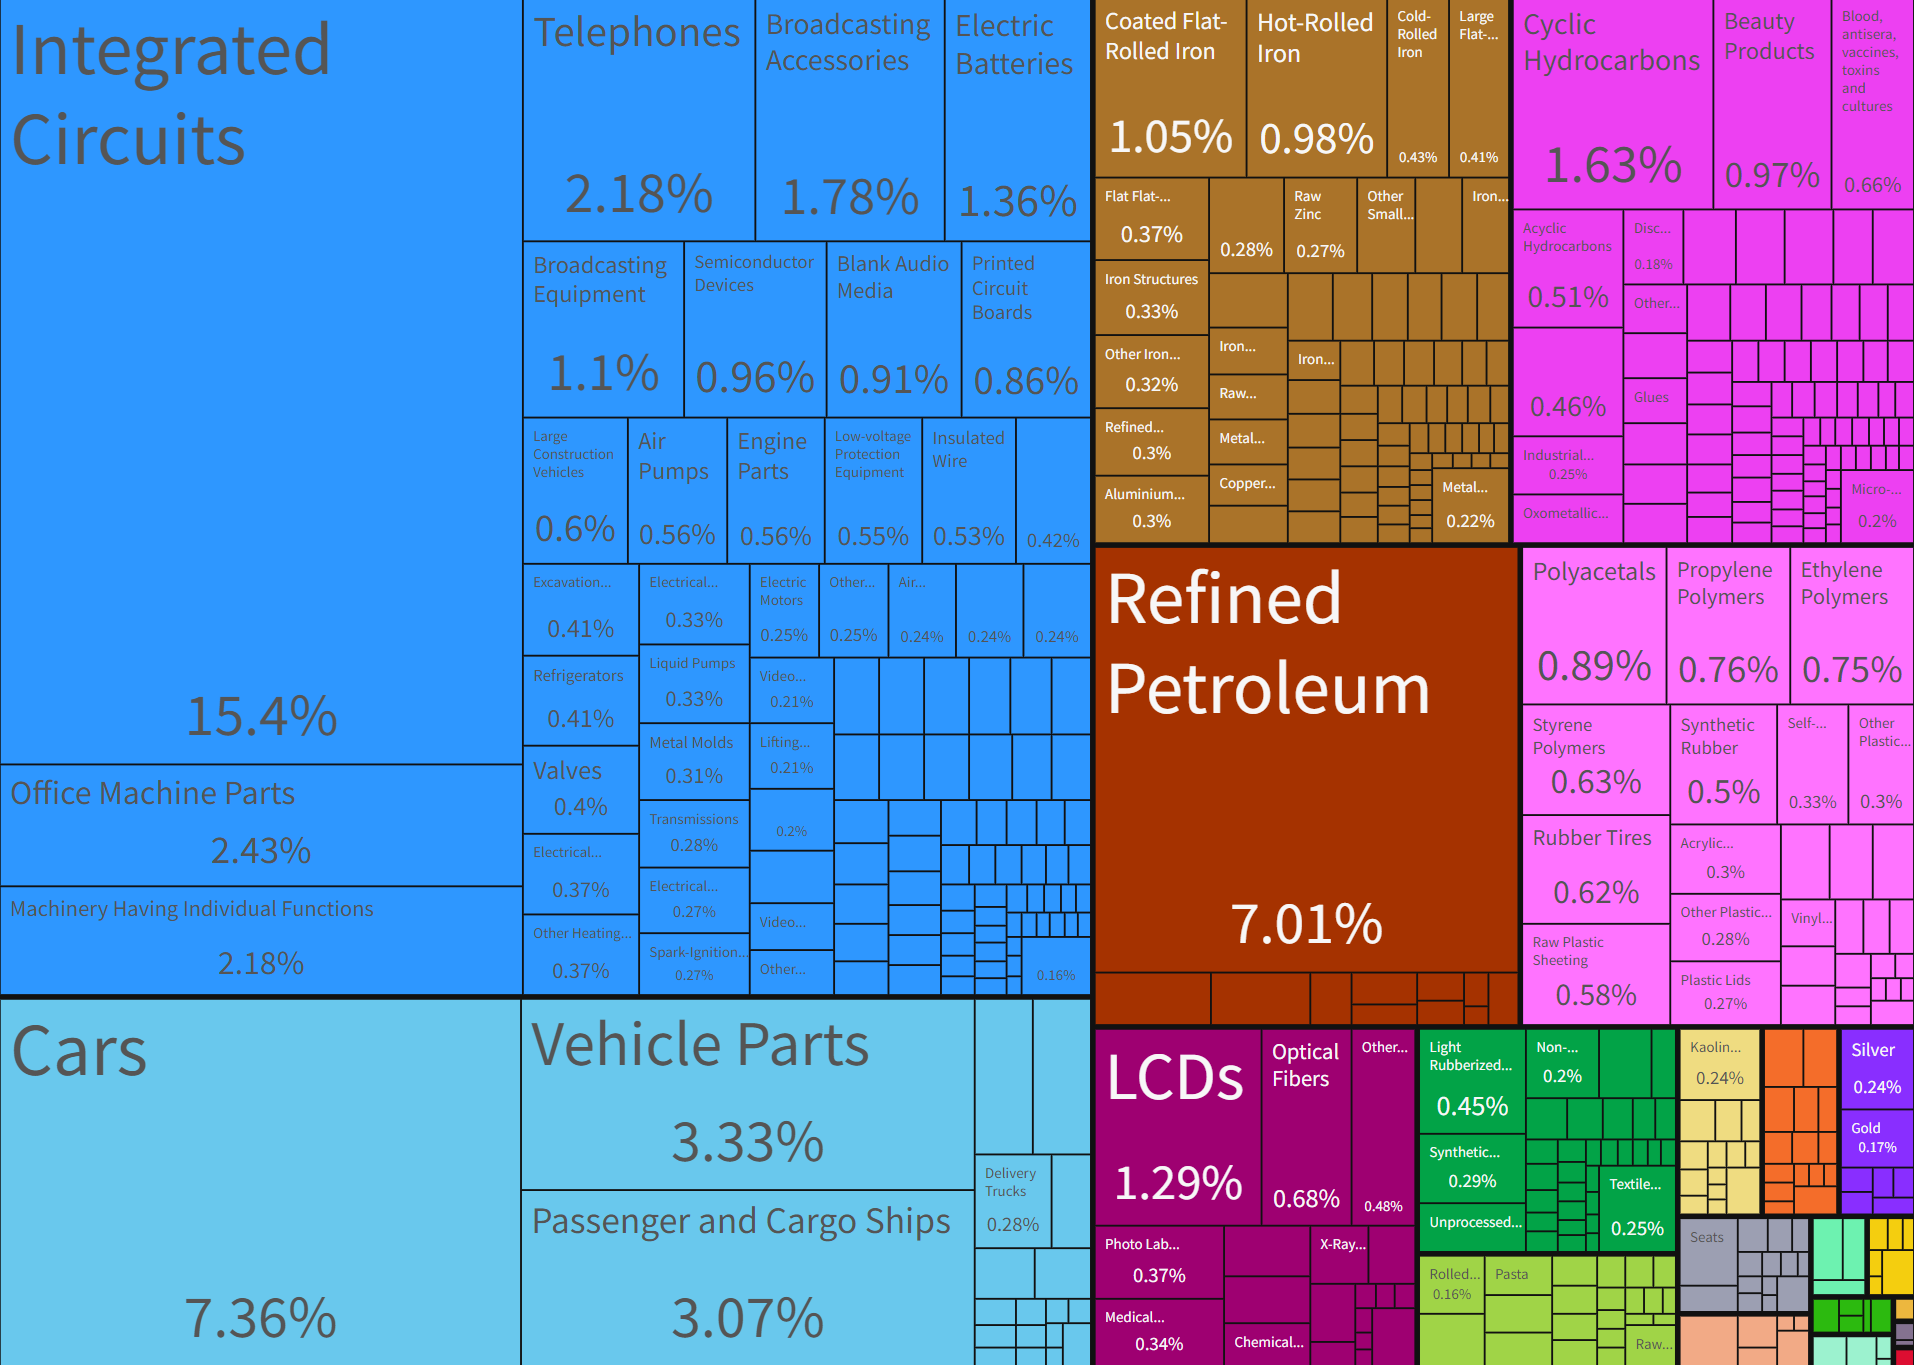
국가별 수출 상품 분포 트리맵
country Exports destinations treemap
한국 south korea
https://oec.world/en/profile/country/kor#latest-data
수출 2019, $555B
일본 Japan
https://oec.world/en/profile/country/jpn#latest-data
중국 China
https://oec.world/en/profile/country/chn
미국 United States
https://oec.world/en/profile/country/usa
독일 Germany
https://oec.world/en/profile/country/deu
영국 United Kingdom
https://oec.world/en/profile/country/gbr
프랑스 France
https://oec.world/en/profile/country/fra
캐나다 Canada
https://oec.world/en/profile/country/can
이탈리아 italy
https://oec.world/en/profile/country/ita
러시아 Russia
https://oec.world/en/profile/country/rus
인도네시아 Indonesia
https://oec.world/en/profile/country/idn
브라질 Brazil
https://oec.world/en/profile/country/bra
터키 Turkey
https://oec.world/en/profile/country/tur
멕시코 Mexico
https://oec.world/en/profile/country/mex
우크라이나 Ukraine
https://oec.world/en/profile/country/ukr
'Etc' 카테고리의 다른 글
| 대한민국 인구 통계 (예상) (0) | 2022.04.25 |
|---|---|
| 한국 국회의원수는 적절한가? (다른 나라와 비교) (0) | 2022.03.03 |
| 나라별 국방비 지출 정보 (0) | 2022.02.28 |
| 반도체 매출(삼성, TSMC, Intel 등) (0) | 2021.11.02 |
| 디아블로 스토리 인물 정리 - 스포일러 주의 (0) | 2021.09.28 |


